
Net Worth Calculators
Net Worth Percentile by Age Calculator
See where your net worth ranks against U.S. households your age — and against the world — using Federal Reserve survey data, not a guess.

Find your percentile
Based on the Federal Reserve's 2022 Survey of Consumer Finances (SCF) — the most recent available; the 2025 SCF is expected in late 2026. Age-specific figures are estimated by scaling the verified overall distribution to your age bracket's verified median.
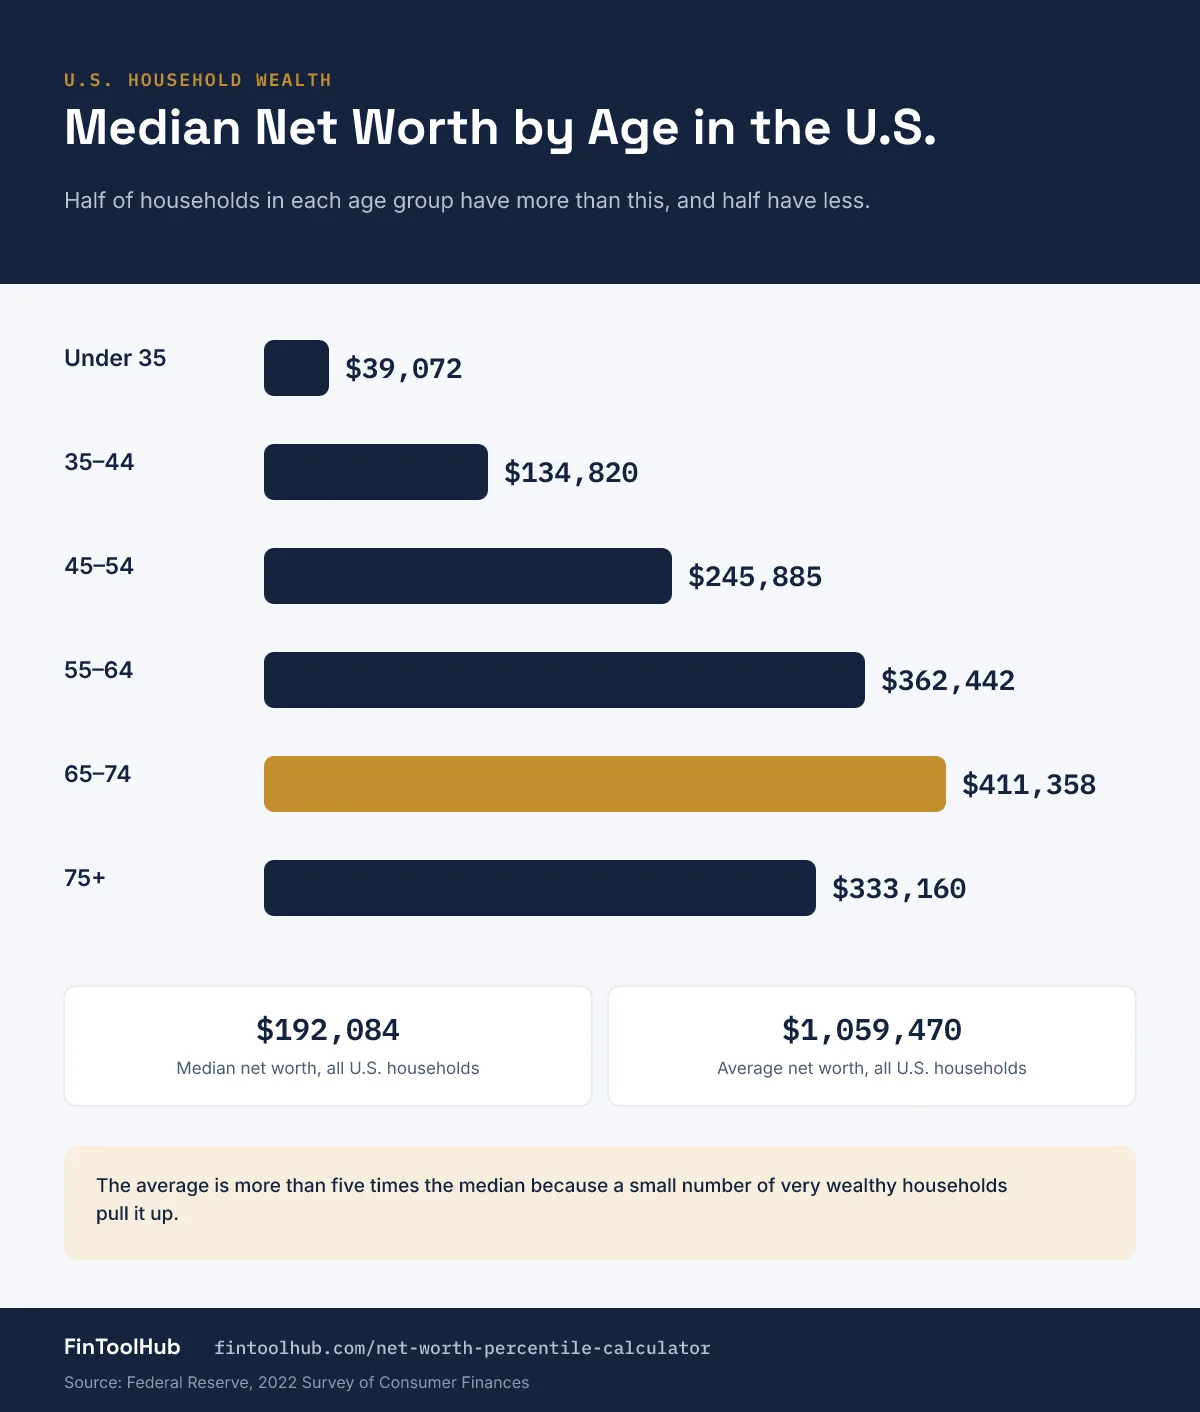
Net worth by age: the reference numbers
A net worth percentile by age calculator, net worth percentile calculator by age, or net worth by age percentile calculator starts with the Federal Reserve's Survey of Consumer Finances (SCF) — conducted every three years and widely regarded as the most comprehensive source of U.S. household wealth data. The most recent wave covers 2022 (released October 2023); the 2025 survey is underway with results expected in late 2026.
| Age bracket | Median net worth (2022 SCF) |
|---|---|
| Under 35 | $39,072 |
| 35–44 | $134,820 |
| 45–54 | $245,885 |
| 55–64 | $362,442 |
| 65–74 | $411,358 |
| 75+ | $333,160 |
Net worth climbs steadily through the 60s and early 70s as decades of saving and home equity compound, then declines in the 75+ bracket as retirees draw down savings.
Why median, not average
The overall U.S. average household net worth ($1,059,470) is more than five times the median ($192,084) — a small number of extremely wealthy households pull the average far above what a typical household actually has. The median — the point where exactly half of households are above and half below — is the far more useful number for comparing yourself to "normal," which is why this calculator and its reference table use median-based figures throughout.
How the age-specific percentile is estimated
The Federal Reserve publishes overall percentile breakpoints with high precision, and this calculator uses those directly for the "all U.S. households" comparison. For the age-specific percentile, the same overall distribution shape is scaled to each age bracket's own verified median — a transparent, disclosed estimation method, not a claim that every single percentile point has been separately published by the Fed for every age group. Treat the age-specific number as a well-grounded estimate rather than an exact published statistic.
Global net worth percentile
A net worth percentile world calculator or global net worth percentile calculator search is asking a genuinely different question, using a different dataset and a different unit of measurement — per adult globally, not per U.S. household. Based on the World Inequality Report 2026: the bottom 50% of the world's adults hold essentially no net wealth, the middle 40% starts around $33,600, the global top 10% starts around $306,000, and the global top 1% starts around $2.3 million per adult. Because U.S. household wealth is unusually high by world standards, a net worth that's middling by U.S. standards can rank quite high globally — switch modes above to see both.
Limitations worth knowing
- SCF data is partly self-reported, and the extreme top of the wealth distribution (the Forbes 400-level ultra-wealthy) is excluded from the survey by design.
- The 2022 data doesn't reflect market and housing moves since — the 2025 SCF (expected late 2026) will be the first full update.
- SCF net worth figures are pre-tax — what you'd actually keep after liquidating assets and paying any resulting taxes would be somewhat lower.
- Global figures use a different unit (per adult) than the U.S. figures (per household), so the two shouldn't be directly compared to each other.
U.S. figures verified against the Federal Reserve's 2022 Survey of Consumer Finances, cross-checked against independently published breakdowns of the same public microdata. Global figures reflect the World Inequality Report 2026. This is an informational comparison, not financial advice. Official sources: Federal Reserve: Survey of Consumer Finances; World Inequality Report 2026.
Frequently asked questions
Before you compare yourself to anyone.
What net worth is considered good for my age?
There's no universal answer, but the SCF median for your age bracket is a reasonable baseline — being above it means you're ahead of at least half of U.S. households your age. The table above gives that figure for six standard age brackets.
Why does the same net worth rank differently depending on my age?
Because typical net worth grows substantially with age as savings compound and homes appreciate — $150,000 represents strong progress for someone in their late 20s but is below the typical range for someone in their early 60s.
Is this data current?
It reflects the Federal Reserve's 2022 Survey of Consumer Finances, the most recent available as of 2026. The next survey (2025 data) is expected to be released in late 2026.
Does net worth include my home?
Yes, in the standard SCF figures used here — home equity is a major component of net worth for most households, especially in the middle of the distribution, where it often represents half or more of total net worth.
How is my global percentile different from my U.S. percentile?
They use different datasets and different units — the U.S. figures are per household from the Federal Reserve, while the global figures are per adult from the World Inequality Report. Because U.S. wealth is high by world standards, a middling U.S. net worth can rank surprisingly high globally.